Category Archives: SQL Server

I am Only Here to Help – sys.xp_logininfo and sys.helplogins

Sometimes you need to find login information. Looking at just the logins on an instance will not allow you to find how a user is connecting. A login maybe nested in an Active Directory group or a login locally to the instance.
SQL server has various commands to provide “HELP”. They can be used to look up or find characteristics of all sorts things like information about users, databases, indexing and much more. This post will look at sys.xp_logininfo and sys.helplogins. SQL 2014 and SQL 2016 have new procedure sys.sp_helpntgroup to further examine rights.
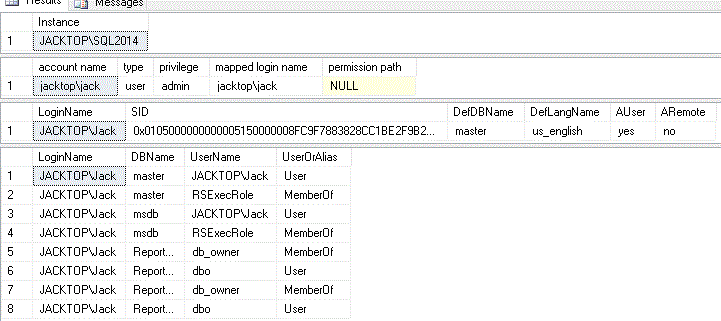
securitylookup

A good practice is to create specific AD groups and add and remove logins from those groups. You standardize the login’s security and access. It also makes it easier to remove access.
Read more »

SQL Agent Jobs Last Run

Sometimes there is a need to see last run time information for a SQL Agent job. You may need to see when the job is scheduled to run next.  The msdb system database contains a ton of information about SQL Agent jobs schedules, activity, job steps and etc..

I created the below query to get a bird’s eye view of job executions. The query is based off msdb.dbo.sysjobs and msdb.dbo.sysjobactivity. These objects have a lot more information that can be added. Tweak the results to meet your needs.

Jobrollup3

Read more »

Database Statistics Health and Update Scripts

I like using Ola Hallengren’s maintenance scripts. Super configuratible, logging, SQl Agent job creation and etc. Sometimes I want to spot check on some of the statistics. Stale statistics can cause cardinality issues with SQL plans.

We learn how database statistics are used:
“The query optimizer uses statistics to create query plans that improve query performance. For most queries, the query optimizer already generates the necessary statistics for a high quality query plan; in a few cases, you need to create additional statistics or modify the query design for best results. This topic discusses statistics concepts and provides guidelines for using query optimization statistics effectively.”

The sample rate is set to full s or 100 percent of the rows will be scanned. A full scan will create overhead.  Need to always look at the impact to your environment. You could have old statistics and not used or duplicate statistics.  In some cases, the higher sample rate can actually cause the plan be less optimal.

Rule of thumb, your queries will perform better with fresh statistics.

I have two scripts to I use to find the health of statistics and update statistics based upon certain criteria.
Read more »

Find Object Execution

I found a useful script to find executions of stored procedure. This will give you a good idea of what is utilization. Run it multiple times to compare how often a procedure of group of procedures executes within certain time periods.

Stored Procedure Executions

Stored Procedure Executions

For example, you have a under performing billing process. Your system fires multiple procedures multiple times. You could use something like this to get an idea of execution counts, worker time, average elapsed time and max logical reads. It will point you in the right direction procedure that can be optimized. Tweak this to fit your needs.
Read more »

Identify Lead Blocker Script

Many third-party tools have  pretty lead blocking graphs and etc. You may not have access to something than grand.  My friend and co-work JD Pellerin wrote this script. He used this as a basis for an SSRS report that can be executed by operations teams to identify potential batch issues. Play around with tweak it to fit your needs.

Blocking Results

Sample Blocking Results

Read more »

AlwaysOn Availability Groups – Query to Find Latency Part 3

Like Part 1 and Part 2, I use a similar query to find latency in AlwaysOn Availability Groups. The queries will return one line for each DB in the group. Part 1 , we looked at a simple query to grab the current status of the replica. Part 2, we looked at populating a Global Temp table every minute to gain a historical perspective of our AG latency. This query will look into creating an email notification when certain criteria is met. It will send the current status to a specific set of email recipients.

The example will be around specific criteria set as a step used in a SQL Agent job. If you use something like this, you need to tweak it to you organization’s needs. I do suggest that you set the job to a frequency that will not overflow your inbox with notices.

Send an email from server when latency for a specfic database datbase is over x number of minutes.

  •  Alter If statement > value for specific needs. This example fires of fthe email when latency is over 60 minutes.
  •  Alter “database_id = DB_ID(‘MyAGDatabase’)” to specify datbase to monitor
  • Alter “@recipients=N’[email protected];” to specify recipients. I suggest using a email distribution list over listing spefic emails.

The example is pretty simple and intended for demonstration purposes.

Read more »

AlwaysOn Availability Groups – Query to Find Latency Part 2

Sometimes there is a need to maintain some historical content on how current your Availability Group is performing. The following script builds off the original script in Part 1. It populates a global temp table with information every minute. I really got the idea from Brent Ozar’s sp_SQL Blitz. I took the road of least intrusive by creating the ##LatencyCheck_tbl global temp table. Sergey Gigoyan has a good post on global temp tables and good links at the end of the post, too.

The ##LatencyCheck_tbl temp table is populated after 1 minute and every minute until cancelled. Need to make sue the table gets dropped after you have done you analysis. It is a good idea to keep an eye on the size of the table, too (execute sp_spaceused ‘##LatencyCheck_tbl’). Like any temp table, service restart will drop the table the process cancelled. If this is something you would like always run. you can look into creating a SQL Agent job or even a procedure that auto starts. I don’t suggest doing that. If you do choose to do so, you should make sure you monitor of have a process in place to reduce the size of the temp table. Also, look into grabbing Perfmon counters and Extended Events. Everything has overhead and we do not want to succumb to the “Watcher Effect”..DAH! DAH! [Organ music].

Read more »

AlwaysOn Availability Groups – Query to Find Latency Part 1

AlwaysOn Availability Groups latency can be a real concern. Microsoft provides a AlwaysON Dashboard to monitor and some administration of Availability Groups in SQL Server Management Studio(SSMS). Ben Snaidero as an excellent posting about the dashboard and T-SQL monitoring of AG.

The query below uses sys.dm_hadr_database_replica_states to query the current state. It can be run on the primary or secondary server. We use a readable secondary and it is nice to see how close to real-time updates. As a roll-your-own solution, you could create a SQL Agent job to monitor and send an email when certain criteria is met.

Read more »

Script to Get SQL Agent Job History

Wanted to share this script. I pieced it together some time ago from various scripts. I think this might be the source for at least some of the query.

Removing the step_ID from the where clause will show run times by step_id and Total RunTime (step_id 0).
Read more »